Thanks for Updating your Flow App!
Flow iOS V1.2.0 / Android V1.3.00
Major update adds the first street-level pollution maps in a few cities and new ways to work with your data—in app and out!
“A map is the greatest of all epic poems. Its lines and colors show the realization of great dreams.”
― Gilbert H. Grosvenor
What’s New

City Wide Maps
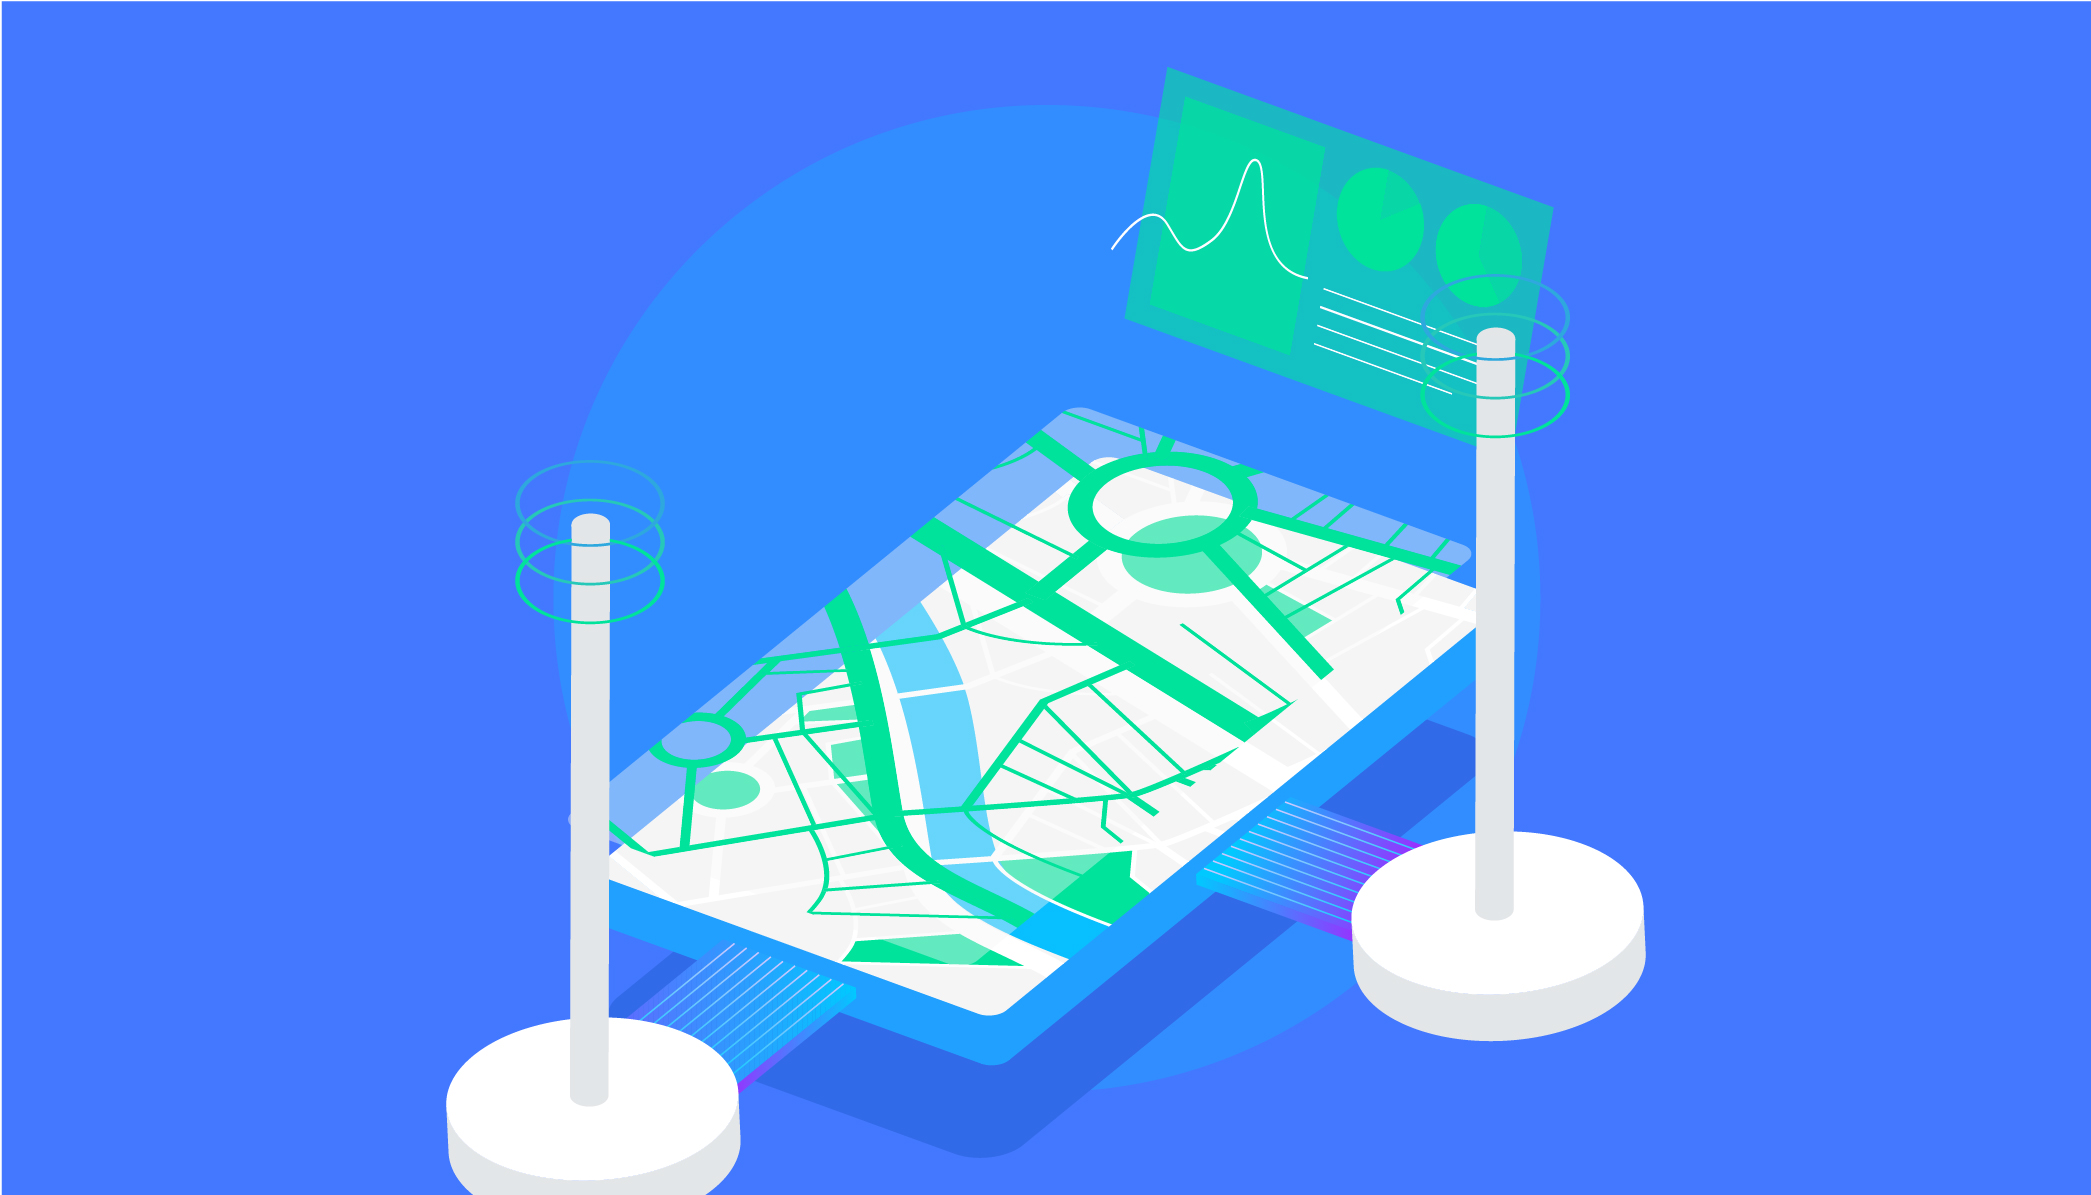
- Explore city-wide air quality with the first round of hour by hour, street by street pollution models. We’ll be adding more cities as new regions reach the right data-density.
- Get into the details of your own maps with full-screen mode on the summary screen.
Your Data, Your Way
New ways to work with your measures in the app and out.

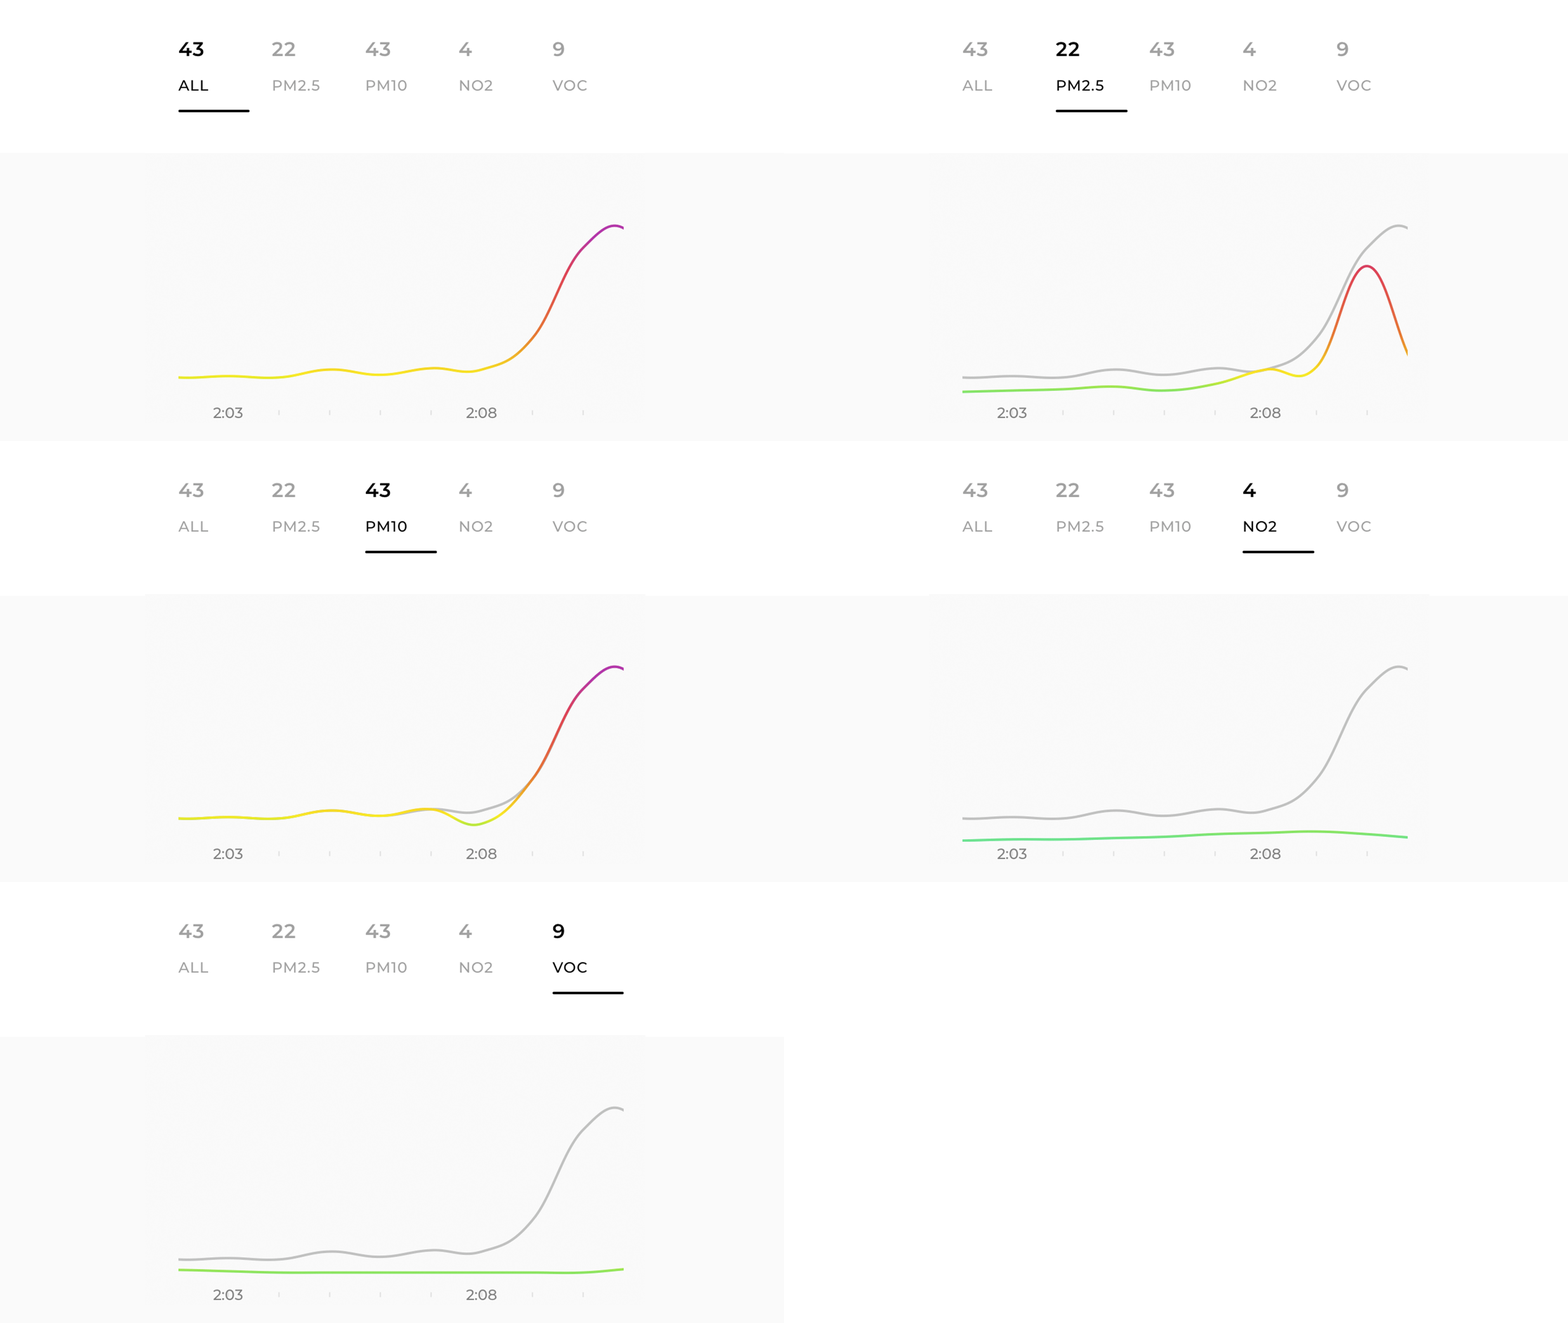
- Filter pollutant by pollutant

- Export your complete data set right from the app
Improvements
- Spots are now visible on daily summaries
- Improved map rendering
- Latest measure is always shown in your feed
- General interface improvements
Fixes
- Warm up animation sometimes stops after switching screens
- Load bar and warm up widget could be visible at the same time
- Live graph sometimes appeared inside a feed item
- Inconsistencies between map and feed item
- Time zone issue in pollution graph