
Data sources used in these maps?
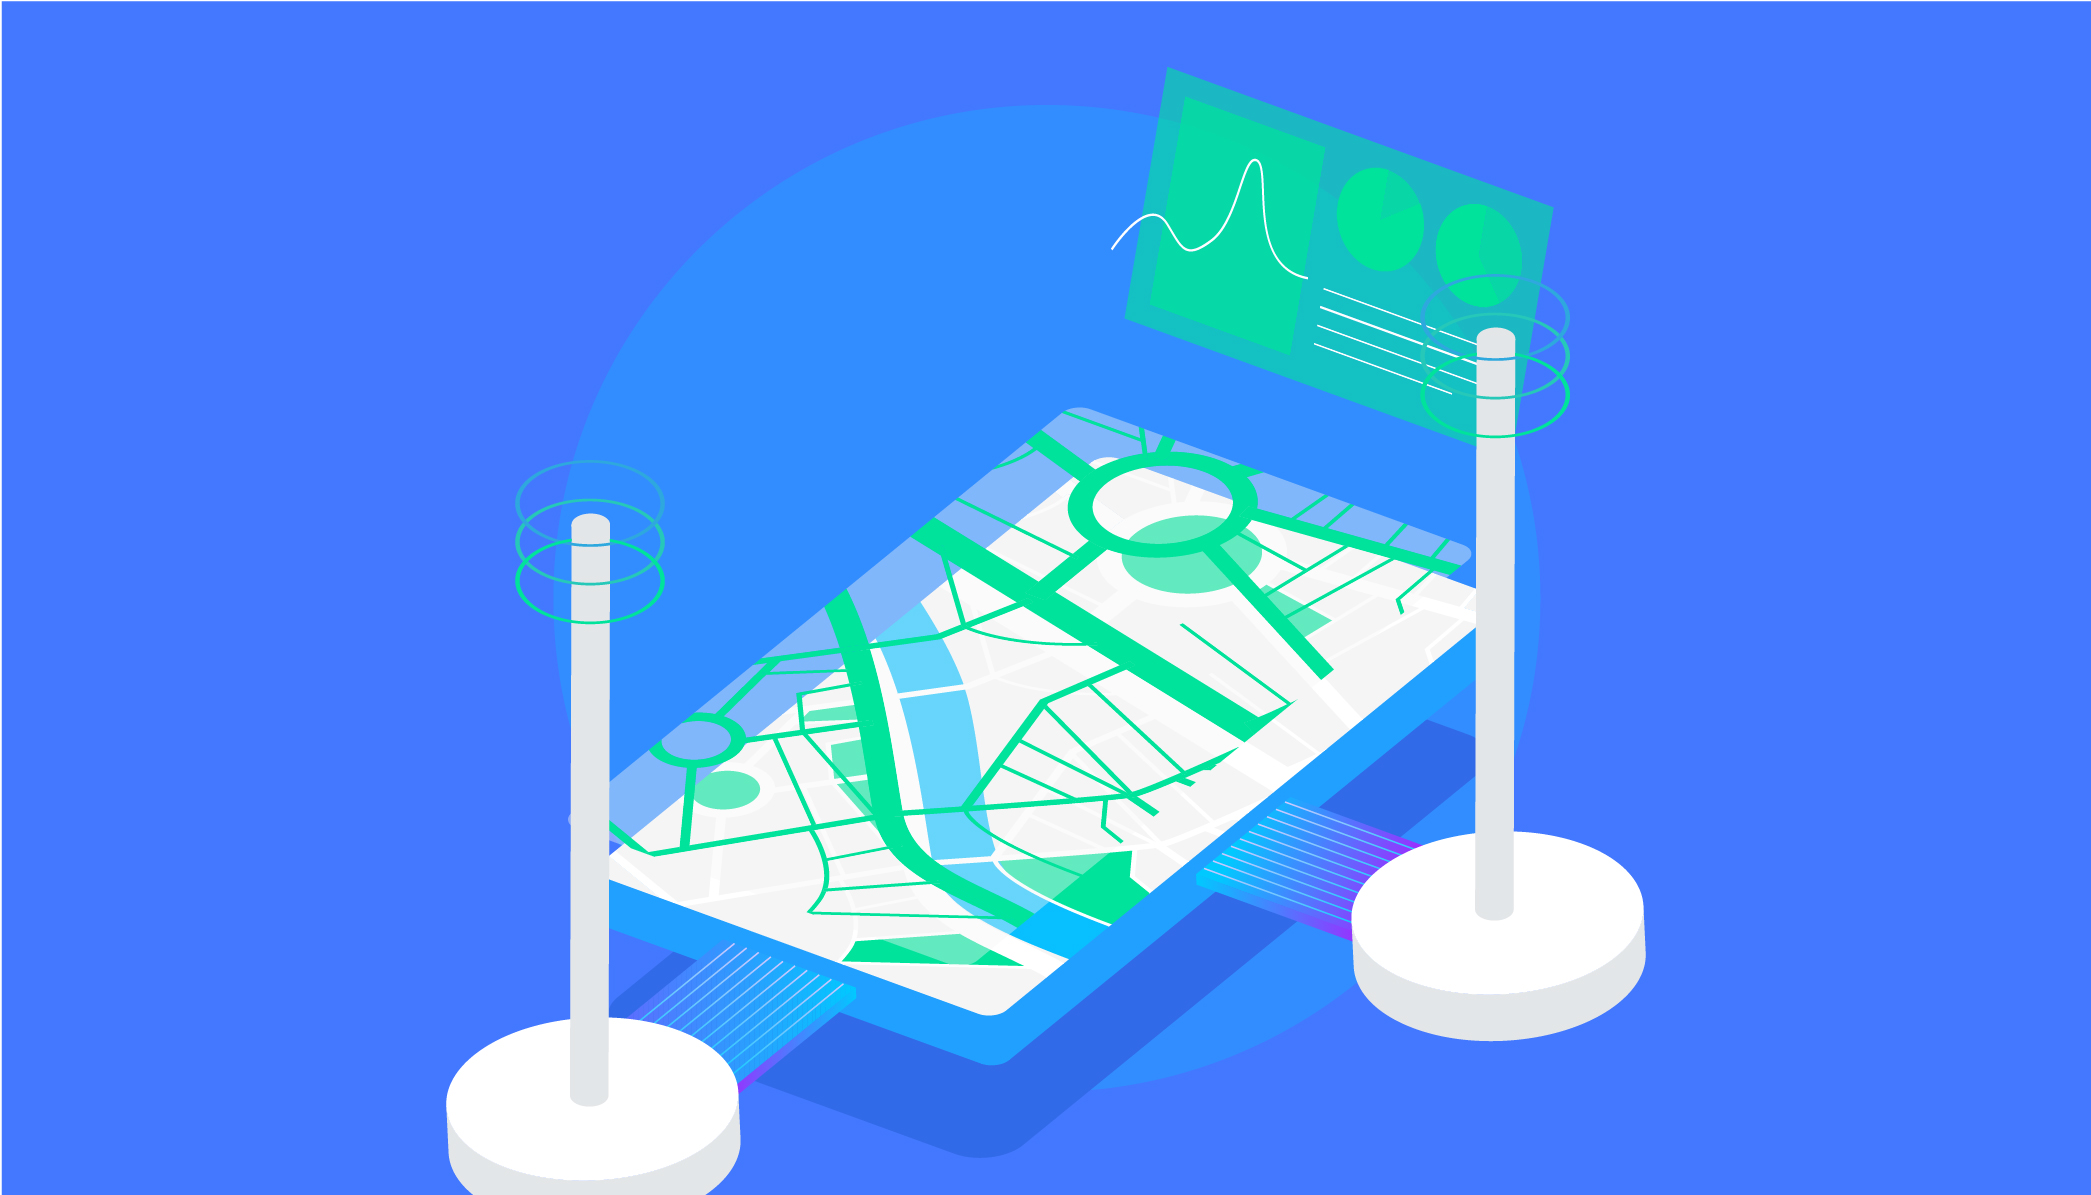
The all-new street by street maps of London and Paris in your Flow app are built with our most advanced machine learning models (not from Flow data—at least not yet).
We think you’ll agree they’re a huge leap forward in terms of getting the info you need to keep pollution out of your lungs. We’ll be adding new cities in the coming weeks. In the meantime zoom-in, explore, and discover new ways of looking at the world.
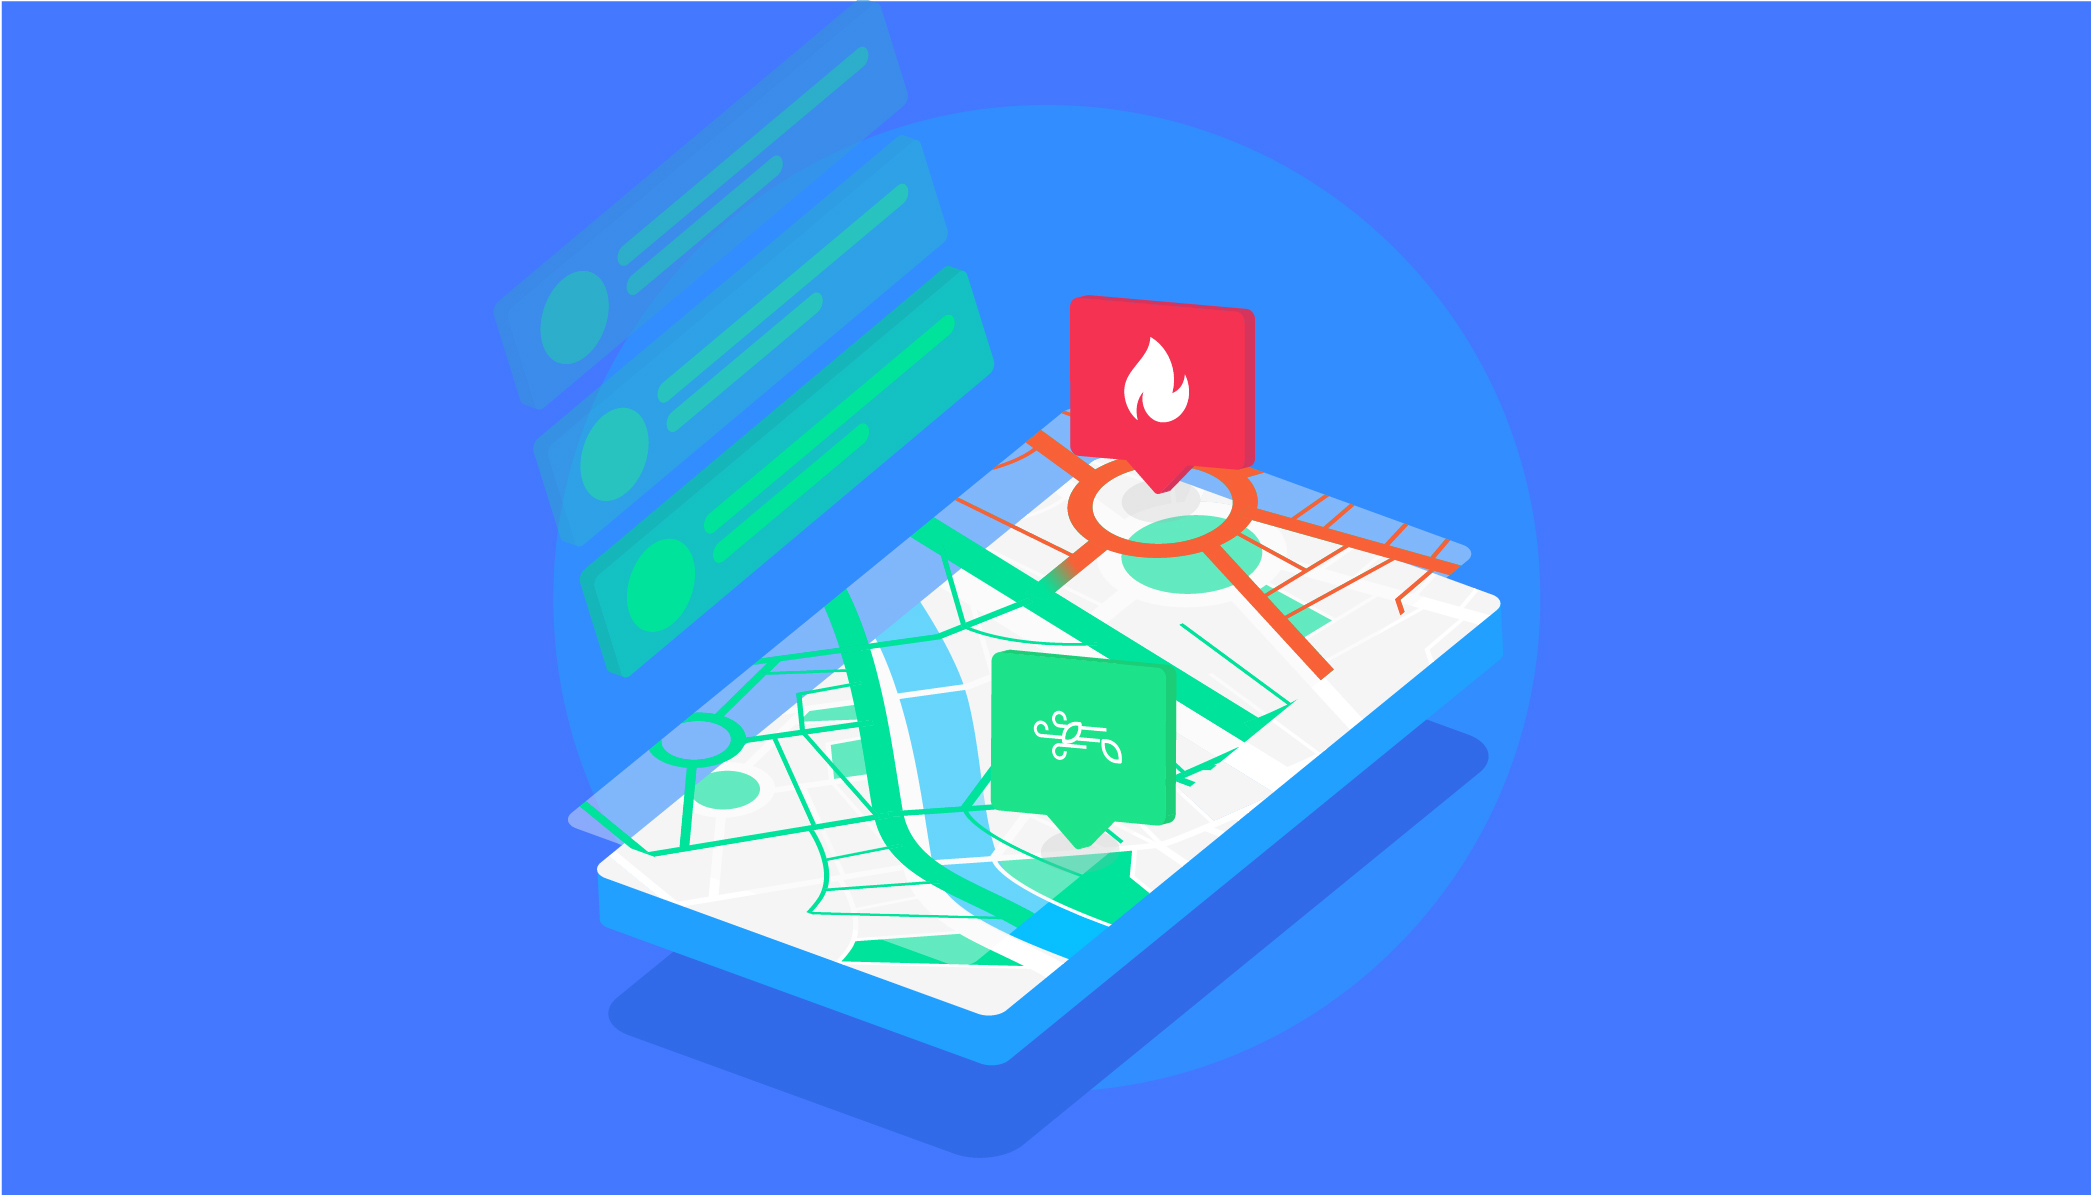
So what’s the big difference between the street by street maps and our free app Plume Air Report? These maps give you air quality information right down to street-level, while Plume Air Report gives you an average air pollution level for the whole city.
Read on for more details and what’s next!
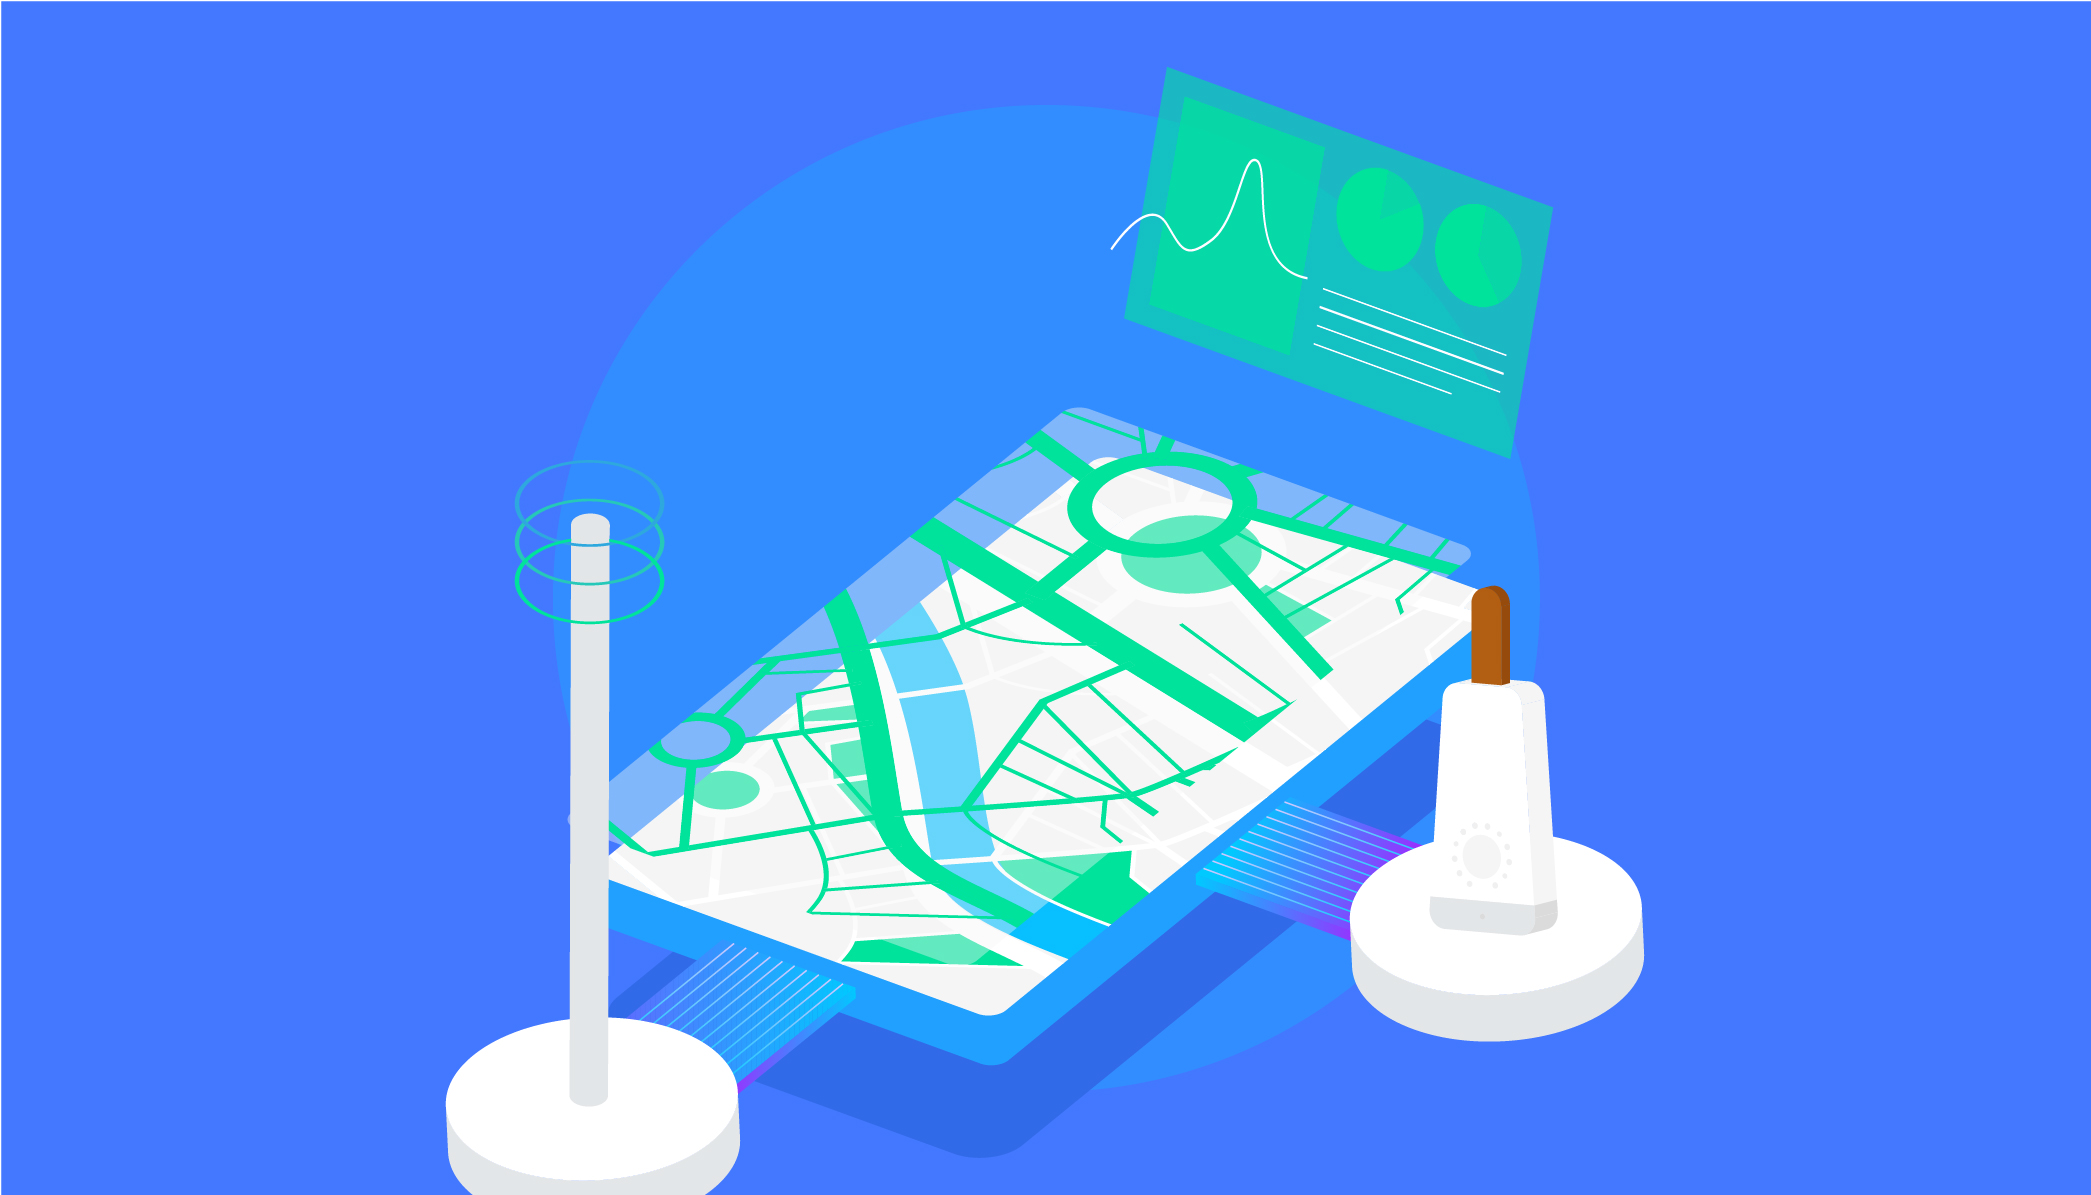
Step 1: Street by street pollution modelling
Timeline: Available now in select cities (more coming soon)
Street by street pollution modelling is the foundation layer for what is to come.
We build each model using a variety of data sets: government monitoring stations, weather, traffic, population density, land-use, and more. We take all this information and put it through our machine learning system to ‘fill-in the gaps’ where there are no actual monitoring stations.
Step 2: The ‘Waze’ of pollution mapping
Timeline: Fall 2019 for select cities
Soon there will be so many Flow community members helping track pollution we’ll be able to create maps in many more cities.
Privacy is number one when it comes to community data so we remove any information that could be considered personal and then aggregate all the data before it gets added to the system. This way everyone with a Flow can help improve the maps with collections of crowdsourced, anonymized air quality info.
So how can I help speed things up I hear you say? Using your Flow regularly adds a ton of data to the system. The more you use your Flow, the more data points we have, and the faster we can make more and better maps. You can also help by recommending Flow to your friends to increase the number of active sensors :)
We’re even working on creating a referral program and we’d love to hear from you if you have any ideas.
Step 3: Community driven pollution tracking
Timeline: Summer/Fall 2019
The Flow community has been seriously busy working to make change and hunting down pollution sources since we released Flow. But don’t take our word for it, check out both Aurelie and Caitlin’s incredible work.
We’re preparing to launch the first part of our community platform—focused on data analysis, visualisation, and citizen science.
A huge thank you to all who have asked us to create a home for your discussions. We’ll also be reaching out for help bringing together real-time, community related features, both in the app and out. Keep an eye out for upcoming PlumeLetters with more info.